Maybe it’s because my son has now reached my own height (which is insane). I find myself staring now and then at the doorway out of my kitchen, where all these little height marks on the doorjamb are labeled with a name and a date. I can see that year when he sprouted up a ton in the four months between his birthday and the start of the school year. And – almost too much to bear—I can see how tall he was at age 15 months.
There are some things from back then that I can’t see on the doorjamb. I can’t see just when he first spoke in full sentences, or when he first spent the night in big boy underpants. But those sure mattered a lot for how we adapted our parenting focus, while they were happening.
How do we measure these milestones, and what kinds of growth do we capture? It’s a critical question in early literacy, too.
Early Literacy in the MAP Suite
We designed our MAP Suite of assessments in early literacy to handle a parallel reality, around measuring what matters in these developmental years. You can see this reality reflected in the nature of reading standards. In most state standards, there are some “anchor” reading standards that span the entire K–12 space, that build upon each other as kids progress in facets of reading comprehension and vocabulary. Measuring those works on a continuous scale – like a doorjamb.
In the MAP Suite, the doorjamb is our RIT scale, continuous from K through 12 in Reading. The tool that makes those height marks is MAP Growth. Even before kids can read independently, they are making progress we can measure on these standards. When a teacher reads a story aloud to her students, she is still asking them to start comparing characters or noticing cause and effect relationships. With MAP Growth K-2, audio support lets us assess reading comprehension even before kids can decode words and sentences.
But state reading standards also include those shorter-lived standards, often called Foundational Skills. These include pieces that are, well, foundational while they matter, but then disappear altogether from the standards by late elementary grades.
If principals and teachers understand how to measure student growth and support students in reaching their potential and if they truly value the ability to deliver a measure that an interim assessment like MAP® Growth™ provides, then consistent data practices can become part of a school or district culture. So believes Cindy Keever, Director of Student Support at the Westfield Washington School District in Hamilton County, Indiana.
Since NWEA assessments and data practices have become an embedded, integrated system of evaluating, understanding, and educating throughout the past decade, Westfield Washington School educators feel confident about their ability to understand where students are in their learning process, no matter how their buildings, classrooms, or instructional groupings are reconfigured over time.
How did MAP Growth data come to be central to the culture of learning?
The district made a firm commitment to providing professional learning for teachers and administrators, to help all become more sophisticated users of data. To this end, they have taken all the Professional Learning (PL) workshops offered by NWEA and continue to deepen their practice. They also created buy-in for the NWEA growth model by making sure it was—and continues to be—completely visible to its entire learning community. Every student, teacher, and parent understands that MAP Growth data shows how kids are growing—and that each student knows where he or she can progress further.
In a post about teaching techniques, Maryellen Weimer cautioned readers about loving techniques for the wrong reasons. When I talk about formative assessment or formative instructional practice, I do share information about strategies and techniques to use that support the pedagogy. But for me, formative assessment goes far beyond the use of strategies and is more about a way of being in the classroom. It is about the engagement of both the teacher and the learners in gathering the evidence of learning to see where “they” (the entire classroom learning team) are in relation to the learning target or goals and using that evidence to make adjustments (on-the-fly) to both learning and teaching to get closer to where the members of the team want or need to be.
Dr. Weimer shares that…
…a collection of techniques has got to be monitored and managed, and that requires a lot more sophisticated skills than those needed to acquire a collection. Even a good technique doesn’t work well for all teachers all the time. There are no cure-all solutions that function effectively with all kinds of content and for all kinds of students. No technique is going to be implemented equally well by all teachers. Our thinking about what a technique can accomplish needs to be a bit less optimistic.
I couldn’t agree more. Over the past 15 years, I have watched teachers embrace the idea of formative assessment, become more mindful of strategies they were using, gather strategies to add to their toolkit, and work hard in their classrooms to implement and integrate those strategies. Where efforts sometimes fall short is in using the results and data gathered from using the strategies.
As part of a process, planning when to use formative assessment within a lesson is valuable, as is being able to use a formative instructional strategy in-the-moment – both of which take practice. The key is using the results and teaching students to use the results. Eliciting and gathering evidence of learning is work for both the teacher and the learners. It is the use of the data that make it formative. Let’s talk about three ideas to consider when it comes to making the use of the data formative.
The use of formative assessment has to be such that the data collected allows the teacher to differentiate the levels of understanding among the learners.
Both learners and teachers need to be able to use the results to see what the level of understanding actually is, and when the learner can make adjustments independently or may need assistance.
When the learner’s understanding is deep enough, the skills and knowledge transfer to new situations. The evidence gathered should provide information about that transfer. This data gathered and used formatively informs the decisions learners and teachers make regarding next steps…
What do chefs, politicians, mechanics, educators, and doctors all have in common? The answer is science and engineering. Most of us probably didn’t realize when we started Kindergarten that science and engineering would affect us every day for the rest of our lives. Science and engineering are all around us – in current events, in the food we eat, even in governmental policies. Science—and therefore, science education—is central to student’s lives, preparing them to be informed citizens, successful problem solvers, and knowledgeable consumers. If kids are to be able to pursue expanding employment opportunities in science-related fields, they must have a solid K–12 science education.
Thanks to new, multidimensional standards like the Next Generation Science Standards (NGSS), K-12 students have access to a high-quality science education that provides them with the skills and knowledge they need to be well-informed citizens, to be prepared for college and careers, and to thrive in modern society. Major advances have taken place in the world of science, engineering, and in our understanding of how students learn science effectively.
The foundation for the new multidimensional science standards is A Framework for K-12 Science Education (2012 NRC) that describes a vision of what it means to be well-educated in science and engineering. So far, 37 states have developed new multidimensional standards, including the 19 states, the District of Columbia, and the American Education Reaches Out (AERO) schools that have adopted the NGSS…
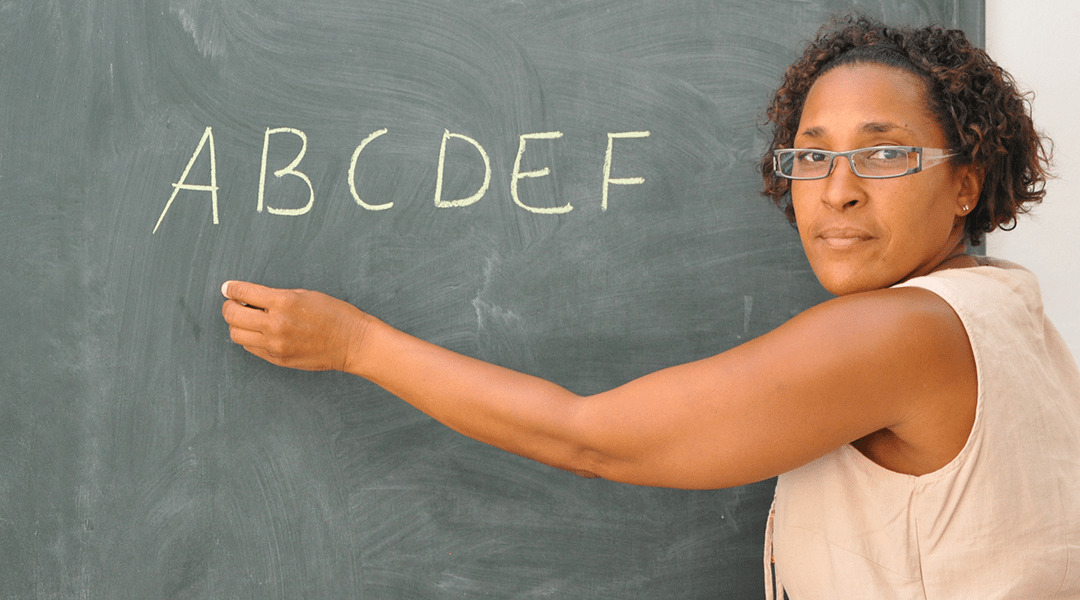
Oral reading fluency is a key indicator of reading proficiency. But it’s got some issues, as it’s currently implemented in some schools. One of these is that we have a cadre of kids who are getting the wrong message: we’re teaching them that they can fast talk their way into college and career success.
Overselling reading speed at the high end
The wrong message is this: faster reading is better reading. And we’ve done a pretty good job of selling that idea to some kids and families these days. Millions of kids read aloud for one minute on grade level passages each season; teachers gauge their words correct per minute (WCPM) as a metric of fluency. If Sally’s “fluency” is 120 words correct per minute and Jane’s is 125, then both girls know who wins. And when Sally reads aloud for one minute next season, she’s going to be very focused on getting those words out faster than she did last time. When we teach kids that more and more WCPM is the goal, we steer them wrong on how literacy for college and career will work.
Unless, of course, their career aspiration is to become a fast-talking auctioneer.
Even back in 1985, proponents of fluency measurement were warning that without an associated focus on comprehension, the one-minute oral reading approach presents some risk of unwanted results (Deno, 1985). Sure enough: researchers have found that the pervasiveness of this isolated WCPM metric moves many teachers towards a “faster is better” orientation as they teach reading (Newman, 2009; Deeney, 2010).
Is oral reading fluency assessment bad? Heck, no. It’s an amazingly robust measure, used well. Revisit this blog for a recap…
Cindy Jiban has taught in elementary and middle schools, both as a classroom teacher and as a special educator. She earned her Ph.D. in Educational Psychology at the University of Minnesota, focusing on intervention and assessment for students acquiring foundational academic skills. After contributions at the Research Institute on Progress Monitoring, the National Center on Educational Outcomes, and the Minnesota Center for Reading Research, Cindy joined NWEA in 2009.
As young kids amaze us all by developing reading fluency (remember this blog?), they typically move toward greater and greater comprehension of what they read. That’s good: reading with comprehension is, after all, the point of learning to read fluently.
But not all kids have enough of what they need to get to reading comprehension. Some kids have strong phonics and word recognition skills, but still fail to comprehend. Others show solid, insightful comprehension when you read TO them, but fall down in comprehending what they read on their own.
What gives? This sounds complicated.
Actually, it’s helpful to focus on how simple it is. An important model for reading comprehension is one asserted by Gough & Tunmer (1986). Their model, the Simple View of Reading, is described by a simple formula: RC = D x LC
This is “simple” because it only has two moving parts, the D and the LC. Just as a simple lever only has two parts, handle and fulcrum, the development of reading comprehension can be modeled as being, at its core, simple.
Decoding (D) is the ability to turn printed words into the right word sounds, more and more automatically. Phonics instruction aims toward increasing decoding proficiency.
Language Comprehension (LC) is the ability to understand spoken words in sentences. When we speak with easier words and less complex structures to very small kids, we are reaching toward their less proficient language comprehension.
In this model, D and LC are multiplied together, not added. That’s important because it means this: when one is weak, you can’t just compensate with a heavier dose of the other…
St. Louis — State education chiefs are scrambling staff duties and outsourcing tasks such as data collection and school improvement efforts as they prepare for new responsibilities under the Every Student Succeeds Act—at the same time they cope with continued funding and staffing pressures.
ESSA, which goes into effect for accountability purposes next fall, is a mixed blessing in the view of state superintendents who have long asked for more flexibility to figure out on their own how best to improve student outcomes.
One big challenge: Budget cuts in recent years have left large swaths of state education departments squeezed on the capacity to carry out the training, data collecting, and innovation necessary to fully exploit that flexibility.
That tension was top of mind this month as the Council of Chief State School Officers gathered here for its annual policy forum.
With all their ESSA accountability plans now submitted to the U.S. Department of Education for approval, state education agencies in the coming months move into the implementation phase, which has the potential to be more arduous and politically contentious than the planning phase that took place over the previous two years…
Fanny Sosenke started the after-school club Girls Who Math because she wants girls to have a safe space to take risks.
The 6th and 8th grade math teacher at Avenues: The World School in New York City, says all too often she sees girls call themselves “stupid” and be quick to ask for help when they struggle to solve a problem. She says boys, on the other hand, chalk it up to simply not knowing the answer and will, instead, keep trying.
Fanny hopes Girls Who Math can ease girls’ anxiety by showing them that math can be cool and fun.
“When girls are by themselves, they’re not afraid to be silly and make mistakes,” Fanny says. “It increases their confidence.”
In Girls Who Math, Fanny tries to make it comfortable for girls through making light of her own mistakes, and by encouraging them to replace “I can’t” with “I’ll try,” and “I don’t know how” with “It will take time, but I can find out how.” Games such as SET, which uses cards to explore puzzle-solving, and the dice-rolling game Tenzi also help create a collaborative learning environment.
Fanny also tries to introduce her students to other creative applications of math. Recently, her girls started developing a math and social justice book to explore how data and social issues intersect. One pair of girls demonstrated the gender wage gap with a detailed graph of how much money a woman can potentially lose over the course of her career.
“It’s another way to make girls interested in math, and show them math can be used in a way to talk about something they care about,” Fanny says.
With Girls Who Math only in its first year, Fanny says she’s already heard from many parents that their kids are more excited about doing math, often sticking with harder problems at home until they get the answer. In her classroom, she’s seen girls from the club be more assertive when raising their hands.
Ultimately, Fanny wants girls to be undeterred from pursuing careers where math is used. She also believes that by giving girls the ability to use math in their day-to-day lives, whether measuring ingredients in recipes or interpreting data in the news, they’ll benefit in the long term.
“I believe in equality,” Fanny says. “If you have strong quantitative skills, you have a big advantage in today’s world.”
“It is my belief that schools can and must be a sanctuary of safety and possibility for all of the young people in their care.” So says Flint Community Schools superintendent Bilal Tawwab, of Flint, Michigan, in a commentary published by Huffington Post.
These are not idle words. Flint has experienced chronic economic decline, as well as a major water crisis that landed the city in the news for all the worst reasons. As Mr. Tawwab puts it, “These challenges our children face – and, in too many cases, the traumas they have experienced as a result – stack the odds against them before they even get to school.”
So it’s exciting to share some good news from this resilient community.
Despite the challenges, students in Flint achieved significant growth as measured by our very own MAP – in part thanks to what Mr. Tawwab calls a wise investment “in the people who can most impact a child’s learning: Teachers.”
Under Mr. Tawwab’s leadership, the district made a series of strategic investments. First, given the water crisis and on-going trauma that many children in the district have experienced, Flint invested in non-academic supports to make sure students have access to healthcare and tools to manage the stress. Then, to support student learning, as Mr. Tawwab says, the district “…invested resources in the people who can most impact a child’s learning: Teachers.”
Flint committed to a professional learning program that included things teachers said they needed. How could they use data from MAP to build individuated education programs (IEPs) for special education students? How could they better use the Learning Continuum to unpack what students were ready to learn next, and where they needed extra help? How could they set goals with students, and talk to them about growth?
Working with NWEA, the team developed a customized program that met the district’s needs and included data coaching, and smart use of NWEA’s different professional learning modules. Throughout, NWEA staff worked with the district closely to ensure that the plan continues to meet teacher needs.
The results speak for themselves. Join us in sending a big congratulations to @FlintSchools on this great news!
The 47th PDK/Gallup Poll of the Public’s Attitudes Toward the Public Schools was released on August 24, 2015. The poll is an invaluable barometer of changing sentiments about K-12 education, and this year the results included an extensive review of attitudes toward testing in America.
Among the key findings:
The majority of parents said they would not excuse their own children from tests, yet this same majority feel there is too much emphasis on standardized testing, and believe they should have the right to opt their children out of those tests.
Nearly one-third of African-American parents say results from standardized tests are very important to improve schools and compare school quality, while only 15% of white parents said the same – a perspective supported by the ongoing advocacy by the NAACP and Leadership Conference on Civil and Human Rights for the inclusion of accountability measures in the reauthorization of ESEA.
One read of these results is that they reflect a growing negative public perception of testing due to the time and money spent on mandated accountability tests, and the painful rollout of new versions. A logical reaction is to reduce this burden, but there is a risk of an overreaction.
America’s students deserve a system where accountability does not trump learning – a comprehensive approach to ensure that kids get their needs met, and that we as a society are fulfilling our obligations to our most vulnerable learners. Significant improvements must be made – and the PDK/Gallup poll underscores the urgency of the issue.
In fact, these data highlight a critical gap in public understanding about assessments and the different ways they serve the learning process – a topic we have been researching for several years. Public opinion research conducted for NWEA showed parents clearly value assessments when they support student learning, provide timely results and take minimal time to conduct. When students were asked, they showed a sophisticated understanding of the difference between assessments that help them grow, and those that do not.
For this reason, NWEA is announcing a major initiative focused on improving assessment literacy for all. The initiative includes a Task Force comprised of both in-service and pre-service experts that will guide efforts to improve assessment literacy nationwide, a newly expanded AssessmentLiteracy.org website offering extensive resources to foster understanding of assessment and its role in learning, and professional learning opportunities for educators.
As a mission-driven not-for-profit, NWEA is committed to helping teachers, education leaders and parents build assessment systems that efficiently and effectively measure student mastery and growth. We are equally committed to helping ensure families, communities and our nation as a whole have the data we need to support each student’s success.
As President and CEO, Matt Chapman leads the Northwest Evaluation Association (NWEA) in achieving its vision for student-centric education grounded in research-based evidence of what helps students learn. Since joining in December 2006, Matt has led NWEA in nearly quadrupling the number of students served, to over 7 million, and introduced new products and services while continuing NWEA’s focus on its mission.


 St. Louis — State education chiefs are scrambling staff duties and outsourcing tasks such as data collection and school improvement efforts as they prepare for new responsibilities under the