Apple Inc is set to print third-quarter financial results after the market closes Thursday. The stock was trading lower heading into the event.
When the tech giant printed its second-quarter results on May 4, the stock surged 4.69% the following day and continued in its uptrend, which eventually led Apple to reach a new all-time high of $198.23 on July 19.
For that quarter, Apple reported EPS of $1.52 on revenue of $94.8 billion. The company came in ahead of estimates for EPS of $1.43 on revenues of $92.96 billion.
For the third quarter, analysts estimate that Apple will print earnings per share of $1.09 on revenues of $74.24 billion.

Ahead of the event, JP Morgan analyst Samik Chatterjee maintained an Overweight rating on the stock and raised a price target from $190 to $235. Read more here…
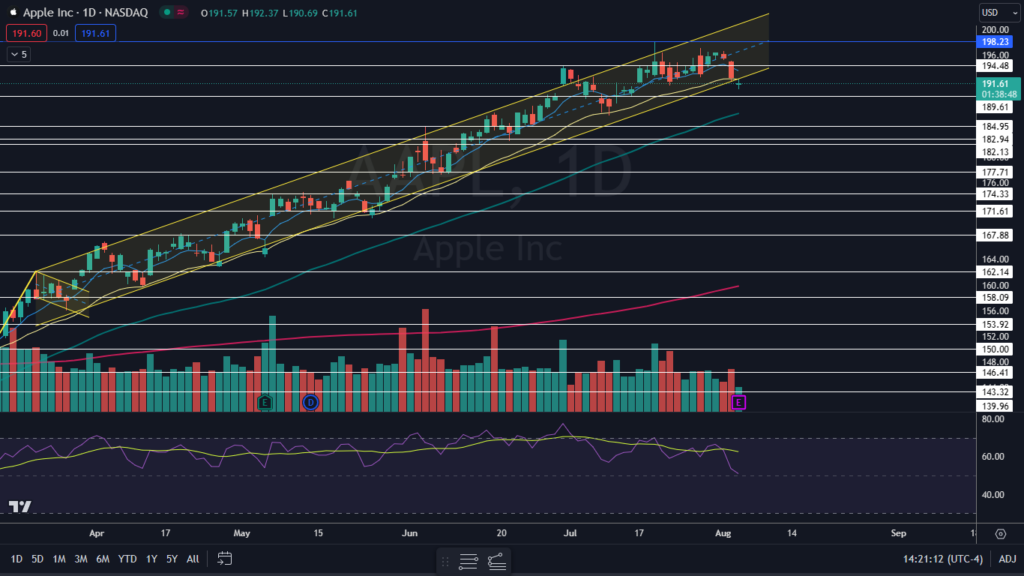
From a technical analysis perspective, Apple’s stock looks neutral heading into the event, having broken bearishly from a rising channel and negated its uptrend but on low volume, which indicates Thursday’s drop could be a bear trap.
It should be noted that holding stocks or options over an earnings print is akin to gambling because stocks can react bullishly to an earnings miss and bearishly to an earnings beat.
Options traders, particularly those who are holding close-dated calls or puts, take on the extra risk because the institutions writing the options increase premiums to account for implied volatility.
The Apple Chart: Apple dropped under the bottom ascending trend line of a rising channel pattern on Thursday but on lower-than-average volume. If the stock receives a bullish reaction to its earnings print and pops back up into the pattern, it may find resistance at the upper ascending trend line of the channel.

On Thursday, Apple was working to print a doji candlestick on the daily chart, which suggests the stock may trade higher on Friday. If Apple suffers a bearish reaction to the news, however, the candlestick will be negated and the stock could fall to test support at the 50-day simple moving average, which is trending at about $187.
If the stock rises but fails to form a higher high over the next few trading days, a downtrend will be confirmed, regardless of whether the stock temporarily trades back within the channel.
If Apple falls on Friday, volatility in the stock market is likely to increase. Traders wishing to play the potential volatility in the stock market can use MIAX’s SPIKES Volatility products. The products, which are traded on SPIKES Volatility Index (XMIO: SPIKE), track expected volatility in the SPY over the next 30 days.
Apple has resistance above at $194.48 and at $198.23 and support below at $189.61 and at $184.95.
Produced in association with Benzinga


